SKC
Animated briefing videos and an interactive investigative map for the Dutch national organized crime intelligence centre.
01
The Brief
SKC, the Dutch Ministry of Justice's knowledge centre on organized crime, needed two things. The first was a set of animated clips for their internal briefing, so clicking through the slides brings global drug flows, cocaine production and criminal organisations to life. The second was the Beeldtafel, an interactive map where analysts and stakeholders explore the same intelligence themselves.
Video · 2 clips
Fig. 01 · Video
One of the 'broader crime' clips, beyond drug trafficking.
Fig. 02 · Video
Global developments in drug trafficking.
02
My Approach
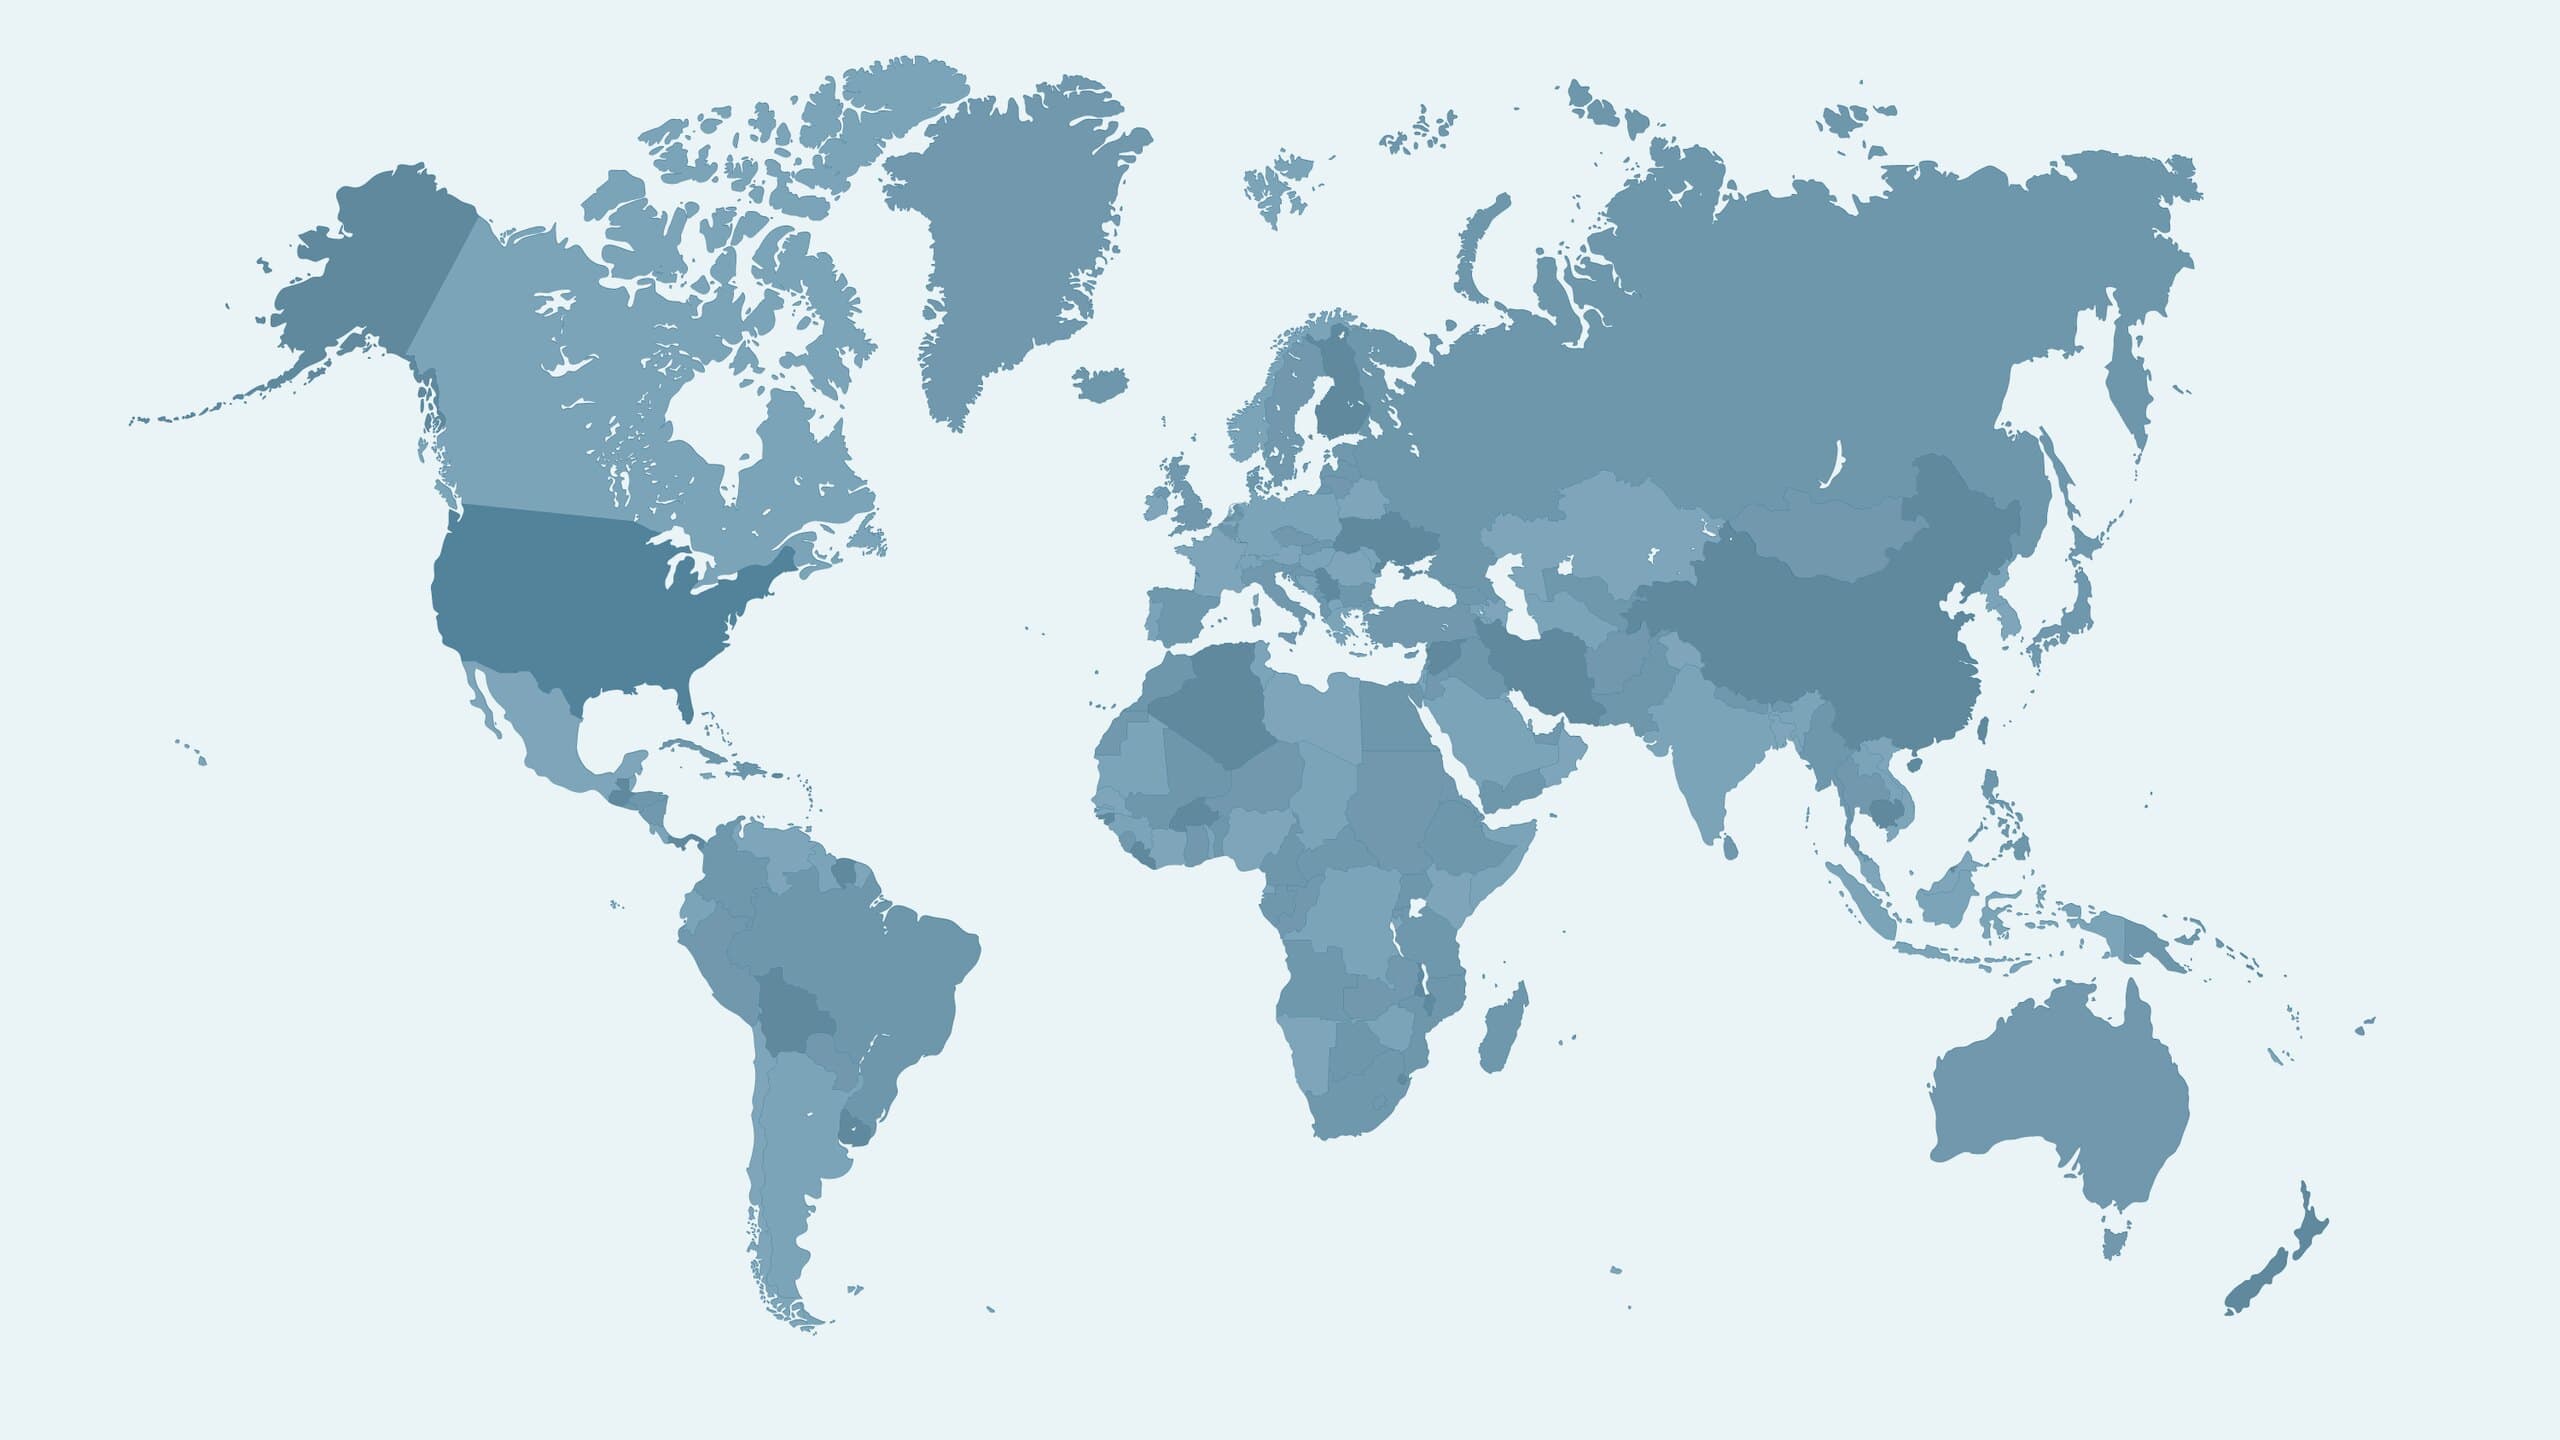
I made all the map graphics in Illustrator, from a world map down to a Netherlands close-up, with overlays for trafficking and money laundering routes. I animated them in After Effects into 18 clips across five topics, each tied to a slide. For the Beeldtafel I built a PlayCanvas app where you pick a smuggling route (cocaine or counterfeit tobacco) and zoom from world to continent to country, switching data layers on and off. Map images only load when they're shown, and each image's position is stored in its file name, so a new data layer can be added just by adding an image.
03
The Result
In the end, SKC got 18 animated briefing clips and an interactive drill-down map with data down to country level.
04
Outcome
Both are in active use at SKC. The Beeldtafel is also shown to law enforcement and government partners as a showcase of what SKC can do. Neither is public.



03 / About
Concept first, medium second
I'm Ramon, a multimedia designer based in Eindhoven. Projects start with a problem: what the thing has to do, and how someone should move through it. The answer has been a 360 film, a VR walkthrough, an explainer animation, a configurator and an AI training platform.
My part is 3D, design and code: modelling and lighting in Blender, interface and motion in XD/Illustrator and After Effects, plus the build in PlayCanvas or Next.js.